Chapter 01 of 34
Why big tables freeze the browser
One <tr> per row works for 100 rows. For 100,000 rows it blocks the browser for minutes.
After this chapter you can
- measure what a plain HTML table costs
- understand why time grows faster than the row count
- know what a data grid has to do besides drawing
The problem
You have to show orders, measurements, log lines, positions – and there are many of them. The obvious solution is a
plain HTML table: one <tr> per record, one <td> per value. It is simple, it is
accessible, and for a few hundred rows it is perfect.
Here it is, written in the most straightforward way – the code from the first video:
function render(rows: Order[]): void { table.innerHTML = ""; const header = table.createTHead().insertRow(); for (const col of columns) { const th = header.appendChild(document.createElement("th")); th.textContent = col; th.onclick = () => sortBy(col); } const tbody = table.createTBody(); for (const order of rows) { // one <tr> per order … const tr = tbody.insertRow(); for (const value of Object.values(order)) { // … one <td> per value tr.insertCell().textContent = String(value); } }}Try it
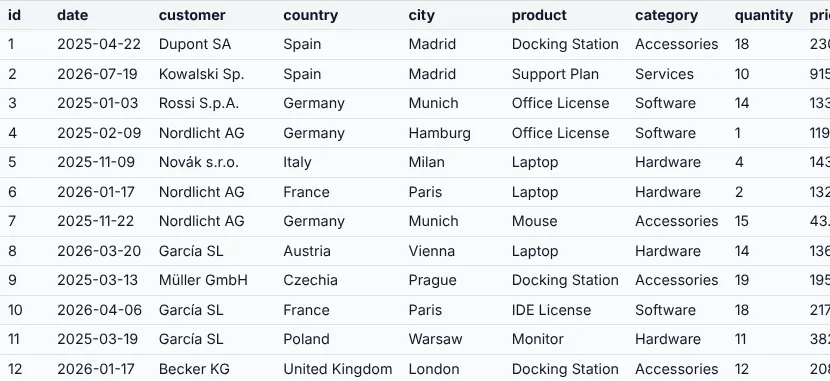
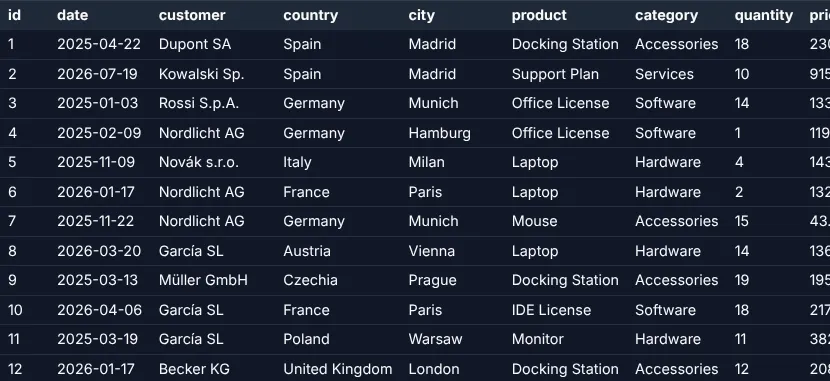
Start the demo with 1,000 rows, then try 5,000 and 20,000. Click a column header to sort. Watch the numbers in the toolbar – and how long the page does not react at all.
The numbers
Measured in Chromium (headless, Linux VM, October 2026) until the browser has really painted:
| Rows | DOM elements | First render | Sort (rebuild everything) |
|---|---|---|---|
| 1,000 | 12,014 | 0.2 s | 0.2 s |
| 10,000 | 120,014 | 2.7 s | 2.9 s |
| 25,000 | 300,014 | 11.7 s | 11.9 s |
| 50,000 | 600,014 | 41.5 s | 44.4 s |
| 100,000 | 1,200,014 | > 2 min (browser blocked) | – |
Twice the rows does not mean twice the time: from 25,000 to 50,000 rows the render time grows by a factor of 3.5. Layout, style calculation and memory grow faster than the number of rows. And sorting is just as expensive as the first render, because every cell has to be built again:
function sortBy(col: keyof Order): void { asc = col === sortCol ? !asc : true; sortCol = col; measure(`sort by ${col}`, () => { // sorting itself takes milliseconds – building every cell again is what hurts orders.sort((a, b) => (a[col] < b[col] ? -1 : a[col] > b[col] ? 1 : 0) * (asc ? 1 : -1)); render(orders); });}And that is only displaying
A real data grid needs much more than drawing rows. All of this is still missing:
- fixed header and fixed columns while scrolling – chapter 18 (Fixed columns)
- column widths, resizing, moving columns – chapter 19 (TableOptions)
- sorting with own rules and filtering – chapter 20 (Sorting), chapter 21 (Filtering)
- selection with mouse and keyboard, copy to the clipboard – chapter 22 (Selection & copy)
- Excel export – chapter 24 (Excel export)
- tree structures, merged cells, inline editing, live updates – parts 6 and 7
Next
The way out is a simple idea: draw only what is visible. In chapter 2 (Virtual scrolling) you build it yourself in about 20 lines – and see why you still want a library for it.