Chapter 36 of 39
Row grouping: totals per country, city or month
100,000 flat orders, one factory call – grouped by country and city, with sums per group and a total row.
After this chapter you can
- group flat rows by one or more columns or computed keys
- show sums, averages and counts per group
- know why an average of groups is not the average of averages
- regroup at runtime without a new model
- filter, sort and edit grouped rows
Tree, grouping, pivot
Your orders come as a flat list. The question is “how much per country – and per city?”. Three tools look alike:
| Tree table | Row grouping | Pivot table | |
|---|---|---|---|
| Input | nested data (children) | flat rows | flat rows |
| Hierarchy | in the data | from the grouped columns | from the row fields |
| Original rows | yes | yes, below their group | no |
| Columns | yours | yours (+ a group column) | made from data values |
| Totals | you compute them | per group and column | in every cell |
The tree table (chapter 30 (Tree table)) needs data that is already nested. Row grouping builds that tree
for you – since @guiexpert/table@1.1.94 with one factory call. Data values as columns: the pivot table
(chapter 37 (Pivot tables)).
One factory call
RowGroupFactory.createTableModel() takes the rows, the columns, the levels and the aggregates. The keys
of aggregations are column properties, the values the aggregators of
chapter 16 (Footer totals) – "sum", "avg", "count", "min",
"max" … or your own:
const tableModel = RowGroupFactory.createTableModel<Order>({ rows: orders, columnDefs: columns, groupBy: ["country", "city"], // levels, top first aggregations: { quantity: "sum", price: "avg", total: "sum" }, // per column, also the total row expanded: 1 // countries open, cities closed});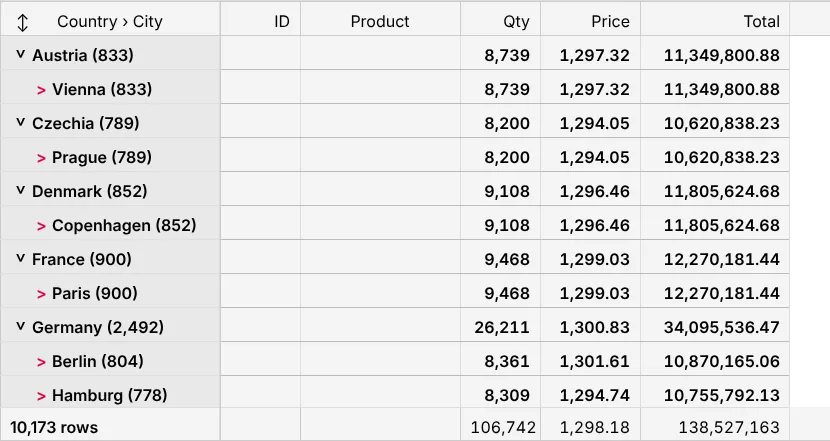
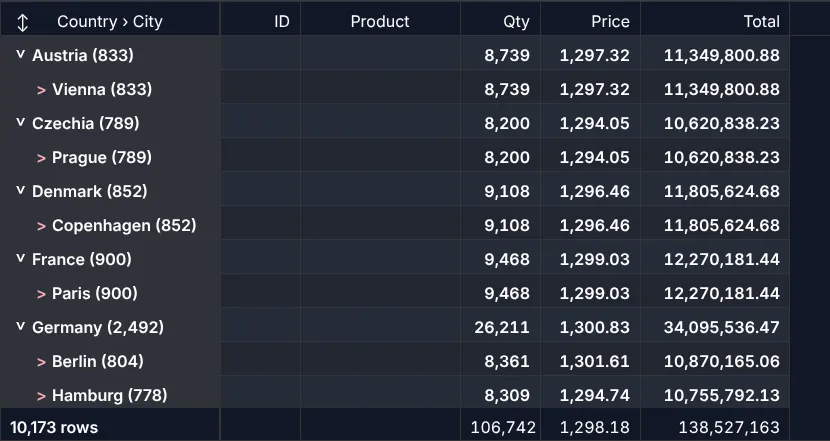
What the factory builds:
- a group column with arrows and labels – the key and the number of its orders, e.g.
"Berlin (804)"– fixed on the left, header"Country › City"; - the grouped columns hidden – their values are in the labels (
hideGroupedColumns: falsekeeps them); - a body model
AreaModelRowGroups– a tree, soTableApi.expandAll(),TableApi.collapseAll(), the keyboard and screen readers work as in chapter 30 (Tree table); - a total row with the same aggregates (
footerAggregates: falseremoves it).
expanded sets what is open at the start: true, false, a number of open levels
(1 = countries open, cities closed) or a function per group.
Levels: columns or computed keys
A level is a property path ("country", "address.city"), a function or the full form
RowGroupFieldIf with a name, a label for the header, a format for the key and an order:
const BY_DATE: RowGroupField<Order>[] = [ { name: "year", label: "Year", value: o => o.date.slice(0, 4), order: "desc" }, { name: "month", label: "Month", value: o => Number(o.date.slice(5, 7)) - 1, format: m => MONTHS[m as number] }];- Groups are sorted ascending by key –
order: "desc","insertion"or your own comparison. null,undefinedand""form one group"(empty)", always last.- Keys are compared as values:
1and"1"are two groups, two dates of the same day one. - Give functions a
name: it is part of the group id that remembers which groups were open.
The average trap
Six sales, grouped by region and product, aggregations: { umsatz: "avg" }:
| Group | Sales | Average |
|---|---|---|
| Nord › A | 100, 120 | 110 |
| Nord › B | 50 | 50 |
| Nord | 100, 50, 120 | 90 – not (110 + 50) / 2 = 80 |
The average of a group is the average of its rows, never the average of its sub-groups. The aggregators keep a
state (sum and count), and a group merges the states of its sub-groups – so every level is right and the
table still visits every row only once. The same holds for your own aggregator if its merge is right
(chapter 16 (Footer totals)).
Filter and sort
The filter function gets your objects – the same function as in a flat table (chapter 21 (Filtering)). Groups without a match disappear, the counts in the labels and all totals follow:
externalFilterFunction: (o: Order) => !query || `${o.product} ${o.city}`.toLowerCase().includes(query)
Sorting (chapter 20 (Sorting)): a double click on Total sorts the groups by their sum and the orders
inside each group by their total; on the group column the groups by key. TableApi.sort() with your own
comparison sorts the orders inside their groups.
Regroup at runtime
A new table model would rebuild the table in every framework wrapper. TableApi.setRowGroupBy() changes
the levels of the existing model – open groups, the filter, the sorting and checked rows stay; the hidden columns and
the header of the group column follow:
api.setRowGroupBy(groupBy); // no new model: expanded groups, filter and sorting stayA group panel where users drag columns is not built in – it is a few lines of UI around this call.
Editing and live data
- Group rows are not editable. An edited value (chapter 31 (Inline editing)) recomputes only the groups of its row – not all 100,000 rows.
- An edited grouped value (the city of an order) moves the row into its new group.
TableApi.updateCells()(chapter 32 (Live data)) updates the visible group rows, too. Changed objects yourself?tableApi.repaint()– changed grouped values:body.regroup()andtableApi.repaintHard().- Excel and the clipboard (chapter 24 (Excel export)) get the group rows with their labels and numbers.
- Open groups are remembered by a stable id (country and city, not the position) – with chapter 33 (Persist state) they survive a reload.
Read the groups
For a chart or a summary: AreaModelRowGroups.getGroups() gives the groups with
label, count, results and their rows (RowGroupIf). Without a table,
groupRows and aggregateRowGroups do the same for any array.
const body = tableModel.getBodyModel() as AreaModelRowGroups<Order>;const perCountry = body.getGroups().map(g => ({ country: g.label, total: g.results["total"], orders: g.count }));Next
Values of a field as columns – revenue per country and quarter: chapter 37 (Pivot tables).