Chapter 27 of 34
Heatmaps and conditional formatting
The colour comes from the value – computed only for visible cells.
After this chapter you can
- style cells with getCustomStyleAt
- add classes with getCustomClassesAt
- use the colour gradient helpers
Styles and classes from the model
Two methods of the area model decide per cell how it looks – without a renderer:
AreaModelIf.getCustomStyleAt()→ inline styles, e.g. a background colour computed from the value;AreaModelIf.getCustomClassesAt()→ CSS classes, e.g.negative,overdue,vip.
Both are called only for visible cells – a colour per cell costs nothing for cells nobody sees.
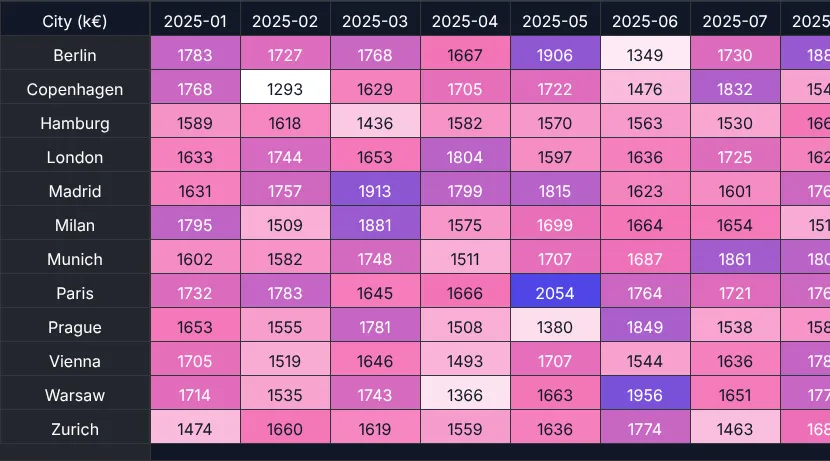
A heatmap: revenue per city and month
The 100,000 orders are aggregated into a matrix – one row per city, one column per month, values in thousand euro.
The body model extends AreaModelArrayOfArrays and adds the colour:
import { AreaModelArrayOfArrays, ColorRgb, GeCssColorUtil, ThreeColorGradientArg } from "@guiexpert/table";
export class RevenueHeatmapModel extends AreaModelArrayOfArrays<string | number> {  private readonly gradient: ThreeColorGradientArg;
  constructor(matrix: RevenueMatrix) {    super("body", matrix.rows, 34);    this.gradient = new ThreeColorGradientArg(      matrix.min, new ColorRgb(255, 255, 255),                       // white      (matrix.min + matrix.max) / 2, new ColorRgb(244, 114, 182),    // pink      matrix.max, new ColorRgb(79, 70, 229));                        // indigo  }
  // called only for visible cells  override getCustomStyleAt(rowIndex: number, columnIndex: number): { [key: string]: string } | undefined {    if (columnIndex === 0) return undefined;                         // the city name    const value = Number(this.getValueAt(rowIndex, columnIndex));    return {      "background-color": GeCssColorUtil.getThreeColorGradientRGB(value, this.gradient),      "color": value > this.gradient.middleValue ? "#ffffff" : "#111827"    };  }}
const tableModel = TableFactory.createTableModel({ headerData: [["City (k€)", ...matrix.months]], bodyAreaModel: new RevenueHeatmapModel(matrix), columnSizes: [150, ...matrix.months.map(() => 90)], fixedLeftColumnCount: 1 // the city stays visible});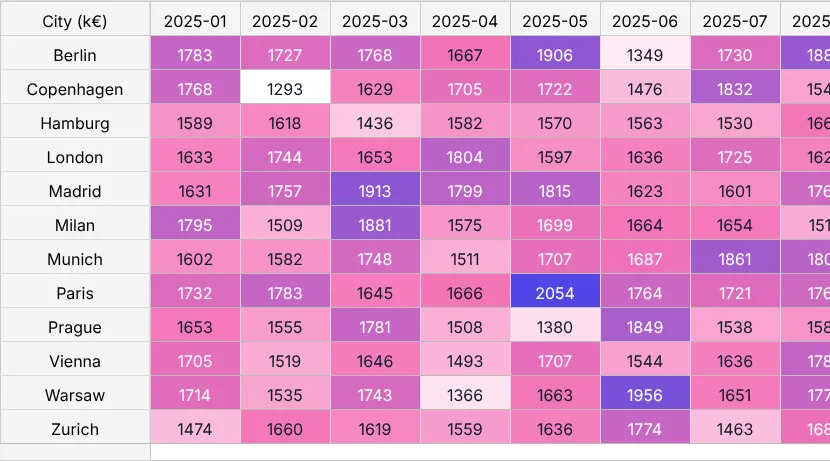
Colour helpers
ColorRgb– a colour as r, g, b.ThreeColorGradientArg– min / middle / max value with a colour each; the two-colour variant isTwoColorGradientArg.GeCssColorUtil–getThreeColorGradientRGB(value, arg)resp.getTwoColorGradientRGB(value, arg)returns a CSS colour.
Conditional formatting with classes
For rules instead of gradients, return classes and style them in CSS:
import { AreaModelObjectArray } from "@guiexpert/table";
export class OrderBodyModel extends AreaModelObjectArray<Order> { override getCustomClassesAt(rowIndex: number, columnIndex: number): string[] { const order = this.getRowByIndex(rowIndex) as Order; const classes: string[] = []; if (order.status === "cancelled") classes.push("row-cancelled"); if (this.columnDefs[columnIndex]?.property === "total" && order.total > 10_000) classes.push("big-order"); return classes; }}// const tableModel = TableFactory.createTableModel({ bodyAreaModel: new OrderBodyModel("body", orders, 34, columnDefs), columnDefs });Showcases
Heatmap and Seattle heatmap – real weather data with a two-colour gradient.
Next
Not one cell, the whole table in your colours: chapter 28 (Theming & dark mode).