Chapter 37 of 39
Pivot tables: countries × quarters in one call
100,000 flat orders become revenue per country, city, year and quarter – with subtotals, totals and a header made from the data.
After this chapter you can
- tell a pivot table from a transposition and from row grouping
- turn the values of a field into columns
- show several values per cell and computed keys like quarters
- know why totals are computed from the rows, not from the cells
- filter, sort, drill down and pivot again at runtime
Pivot is not transposing
“Revenue per country and quarter” – the countries as rows, the quarters as columns. Transposing would only swap rows and columns of a table you already have. A pivot table does three things at once:
- group the rows by row fields (country › city – a hierarchy, as in chapter 36 (Row grouping)),
- turn the values of column fields into columns (2025, 2026 › Q1 … Q4 – a header made from the data, as in chapter 15 (Header groups)),
- aggregate a value per row × column, with subtotals and totals (the aggregators of chapter 16 (Footer totals)).
So the number of columns depends on the data, and there are no detail rows: every cell is a total. Since
@guiexpert/table@1.1.94 this is one factory call – MIT-licensed; in ag-Grid pivoting is an Enterprise feature.
One factory call
PivotFactory.createTableModel() takes the rows, the row fields, the column fields and the values.
Fields have the form of a row grouping level – a property path, a function or RowGroupFieldIf with
name, label, format and order. The year and the quarter are functions of the order date:
const YEAR: RowGroupField<Order> = { name: "year", label: "Year", value: o => Number(o.date.slice(0, 4)) };const QUARTER: RowGroupField<Order> = { name: "quarter", label: "Quarter", value: o => Math.ceil(Number(o.date.slice(5, 7)) / 3), // 1 … 4 format: q => `Q${q}`};const tableModel = PivotFactory.createTableModel<Order>({ rows: orders, rowFields: ["country", "city"], // rows: a hierarchy with subtotals columnFields: [YEAR, QUARTER], // columns: made from the data values: REVENUE_AND_ORDERS, // in every cell expanded: 0, // countries closed valueColumnWidth: px110});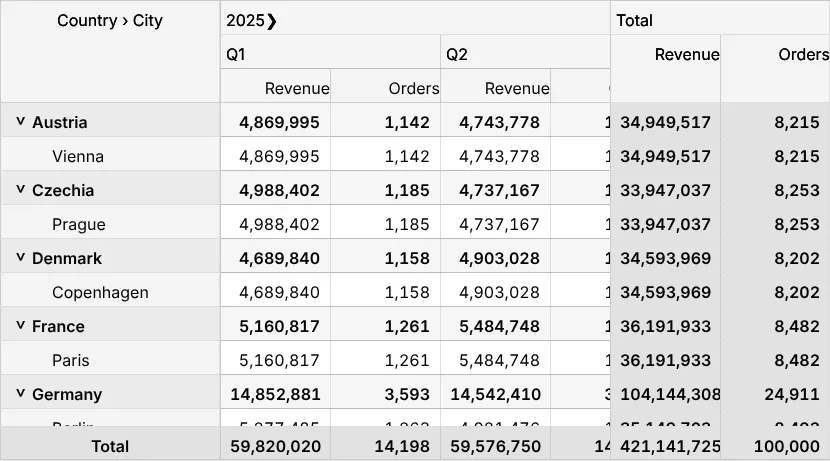
What the factory builds:
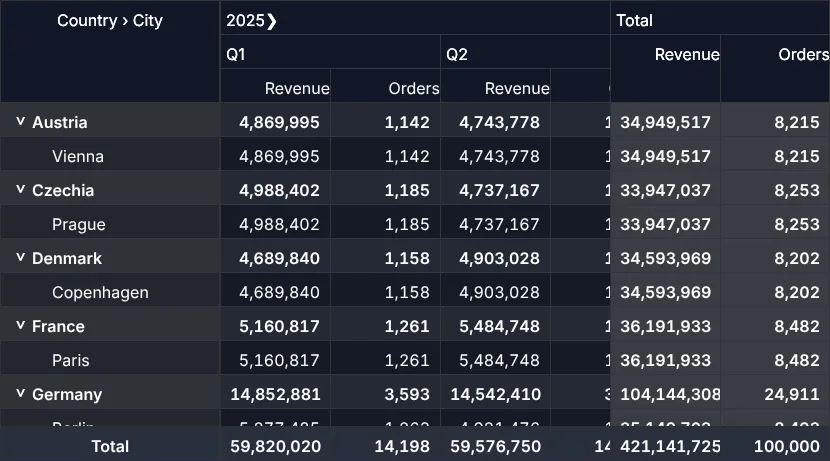
- a group column with arrows and labels, fixed on the left (header
"Country › City"); - one column per column key × value – with two column fields a two-row header, and behind every year a
year total (
columnSubtotals): the arrow of the year collapses it to that total, the widths of the other columns stay; - the total columns fixed on the right (
totalColumn: truelets them scroll,falseremoves them) and a total row in the footer (totalRow: false); - a
PivotTableModel– a normal table model for every framework wrapper – with anAreaModelPivotas body: a tree, soTableApi.expandAll(), the keyboard and screen readers work as in chapter 30 (Tree table).
Several values, computed keys
A value is a property path ("total" – summed) or PivotValueIf with an aggregator, a
label and a format. Two values give every column key two columns:
const REVENUE_AND_ORDERS: PivotValue<Order>[] = [ { value: "total", label: "Revenue", format: money }, // sum is the default { value: "id", aggregator: "count", label: "Orders" }];- Keys are sorted ascending –
order: "desc","insertion"(order in the data) or your own comparison, e.g. month names in calendar order. null,undefinedand""are one key"(empty)", always last – for rows and columns.- A combination without orders stays empty (
undefined, an empty cell in Excel) – not 0.emptyText: "–"shows a dash. - Too many column keys?
maxColumns(default 1,000) cuts them off with a warning – the totals still count every row.
The average trap
Six sales, rowFields: ["region"], columnFields: ["monat"], the average of umsatz:
| Jan | Feb | Total | |
|---|---|---|---|
| Nord | 100, 50 → 75 | 120 → 120 | 90 |
| Süd | 80 → 80 | 70, 30 → 50 | 60 |
| Total | 76.67 – not (75 + 80) / 2 = 77.5 | 73.33 | 75 |
A subtotal or total is never computed from the finished cells. Every cell keeps the state of its aggregator
(sum and count), and subtotals and totals merge these states – first along the columns, then along the rows. One pass
over the rows, and every level is right – also for your own aggregator if its merge is right.
Filter and pivot again
The filter function gets your orders – the same function as in a flat table (chapter 21 (Filtering)). It works before the aggregation: all cells, subtotals and totals follow, rows without a match disappear, the columns stay:
externalFilterFunction: (o: Order) => !query || `${o.product} ${o.category}`.toLowerCase().includes(query)
A new table model would rebuild the table in every framework wrapper. TableApi.setPivotConfig() changes
the fields, values or rows of the existing model – the same table gets new columns; open rows, the filter and the
widths of columns that stay are kept, sorting and selection start fresh:
api.setPivotConfig({ columnFields }); // same model, same table: new columnsSort, export, drill down
- A double click on a value header sorts the rows of every level by that value, empty cells last (chapter 20 (Sorting)); on the group column by key.
- Excel and the clipboard (chapter 24 (Excel export)) get the pivot as you see it: header labels, raw numbers, subtotals and totals.
- Which orders are behind a number?
AreaModelPivot.getCellSourceRows():
listener.onMouseClicked = (evt: GeMouseEvent) => { if (evt.areaIdent !== "body") return; const body = tableModel.getPivotBody(); const rows = body.getCellSourceRows(evt.rowIndex, evt.columnIndex); // the orders behind the cell ctx.info(`${body.getRowGroup(evt.rowIndex)?.label ?? ""}: ${fmt(rows.length)} orders`);};For a chart next to the table, AreaModelPivot.getResult() gives the keys and every value – and
pivotRows does the same for any array without a table:
const result = pivotRows(orders, { rowFields: ["country"], columnFields: [YEAR], values: ["total"] });const perCountry = result.rowGroups.map(r => ({ country: r.label, revenue: result.getValue(r) }));Next
Back to the overview of all chapters, or the checklist for your own table: chapter 34 (Checklist & finale).