Enhancing Data Table UI
Key Elements for Success

- Marc Kronberg
- Dec 17, 2023
Without the capacity to visualize and take action, data holds no value. The future triumph of industries hinges on merging sophisticated data collection with enhanced user experiences, wherein the data table forms a substantial part of this interaction.
Effective data tables empower users to swiftly scan, analyze, juxtapose, refine, arrange, and interact with information, enabling them to extract valuable insights and take decisive actions. This article furnishes a compendium of design frameworks, interaction models, and methodologies aimed at aiding the creation of superior data tables.
In this article, we’ll explore the following pivotal aspects:
- Fixed Header
- Fixed Columns
- Resizable columns
- Column sorting by mouse drag
- Row Style
- Colspan and Rowspan
- Toggle Display Density
- Rows filtering (Search)
- Sortable Columns
- Hover Actions
- Inline Editing
- Tree Tables
- Add / Remove Columns
- Cell Selection and Copy Action
- Rapid Cell Updates
- Large data sets
- Virtual Scrolling
- Chunk loading
Fixed Header
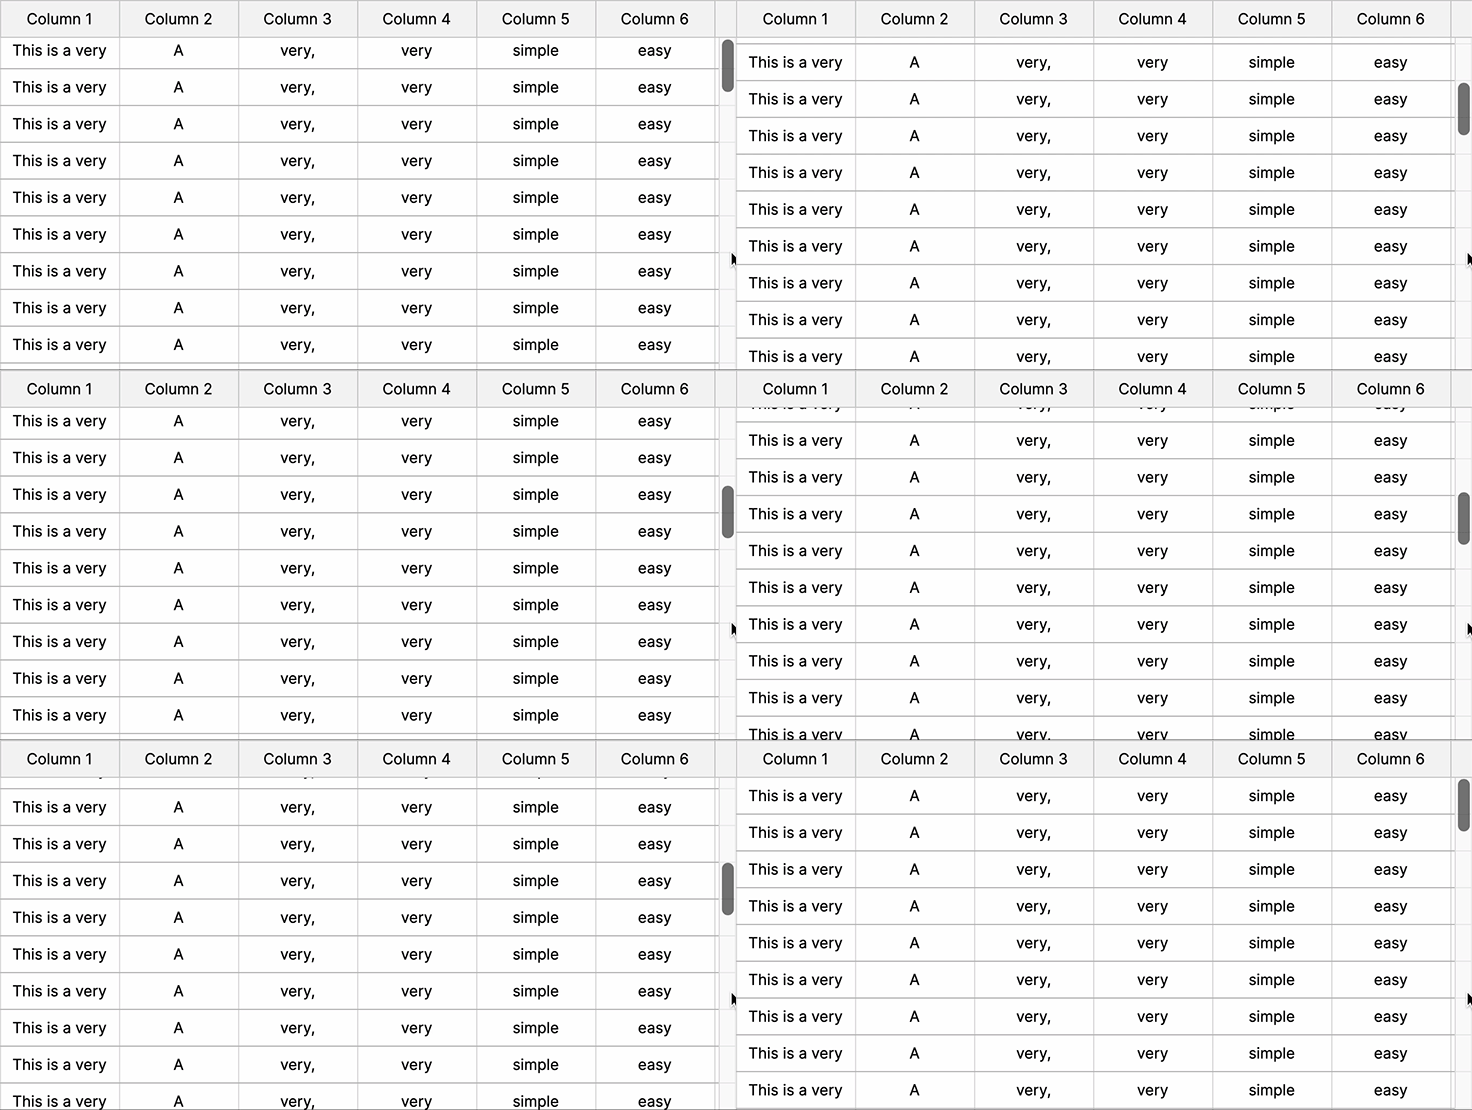
Fixed header and footer maintain table structure during scroll, providing constant context and easy access to crucial information, improving user navigation and comprehension within large datasets displayed on the web.
Fixed Columns
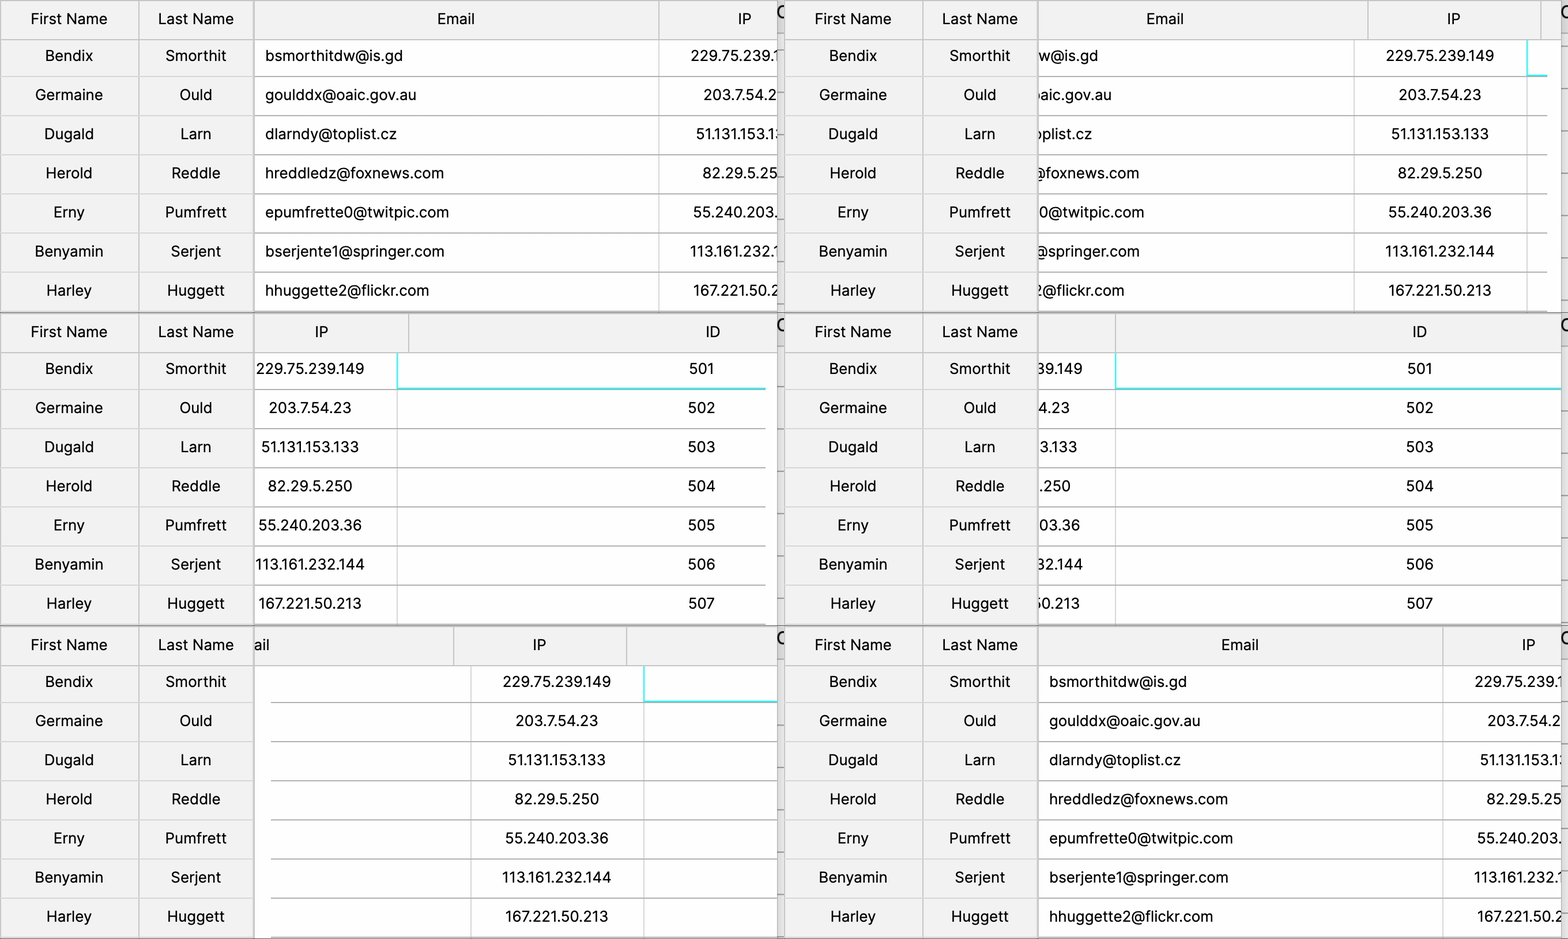
Fixed columns ensure key information remains visible while horizontal scrolling.
Resizable columns
Resizable columns grant users control over data presentation, optimizing readability and usability. This feature accommodates varying content lengths, allowing customization for clearer data visualization and streamlined navigation within tables or grids.

Column sorting by mouse drag
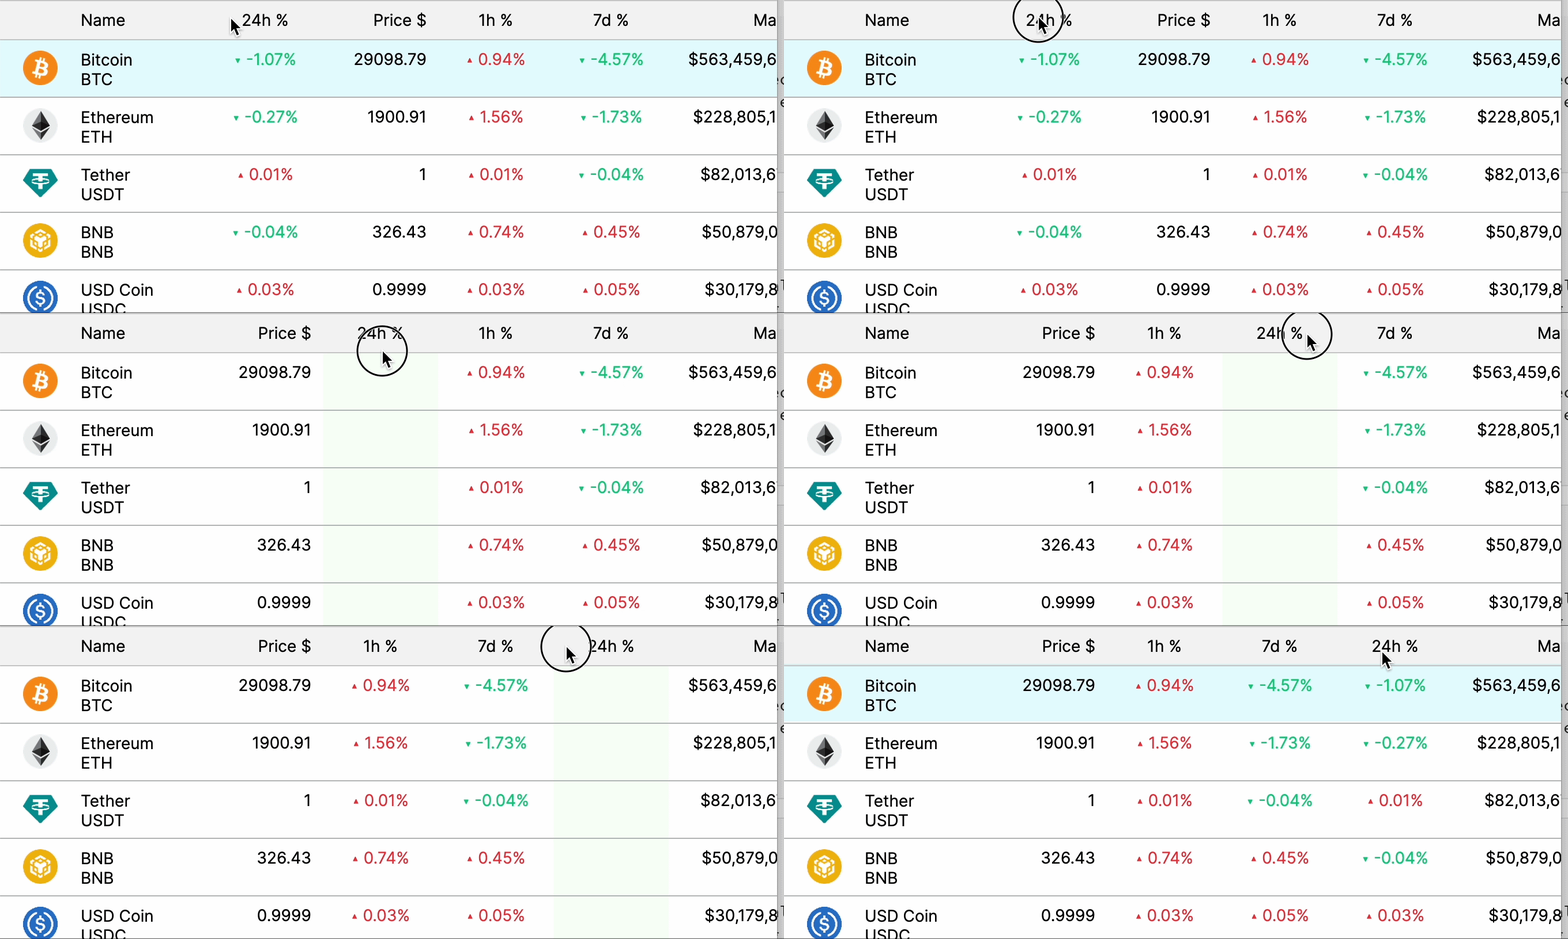
The customizable columns feature empowers users to select the specific columns they wish to view and arrange them according to their preferences. This functionality may encompass the option to save customized column arrangements as presets for future use.
Row Style
Zebra stripes, borders, and contextual colors aid visual organization, enhance readability, and provide clear data differentiation, facilitating easier scanning, reducing eye strain, and improving user comprehension within data-rich environments.

Colspan and Rowspan
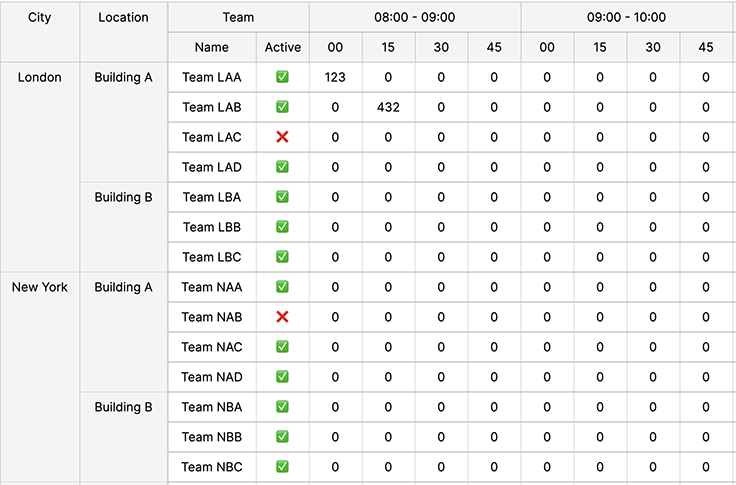
The rowspan and colspan attributes in a web UI’s data table header, body, and footer are crucial for structuring complex data relationships. These attributes enable cells to span multiple rows or columns, allowing for clearer organization and representation of hierarchical or grouped information. In the header, they consolidate related categories; in the body, they group interconnected data; and in the footer, they summarize data comprehensively. These features enhance readability, streamline data comprehension, and offer a more intuitive visual representation, facilitating efficient analysis and understanding within the data table interface.
Toggle Display Density
Adjusting the display density of a data grid is vital for accommodating varied user preferences, optimizing screen space, enhancing readability, and providing a tailored viewing experience for efficient data absorption and analysis.
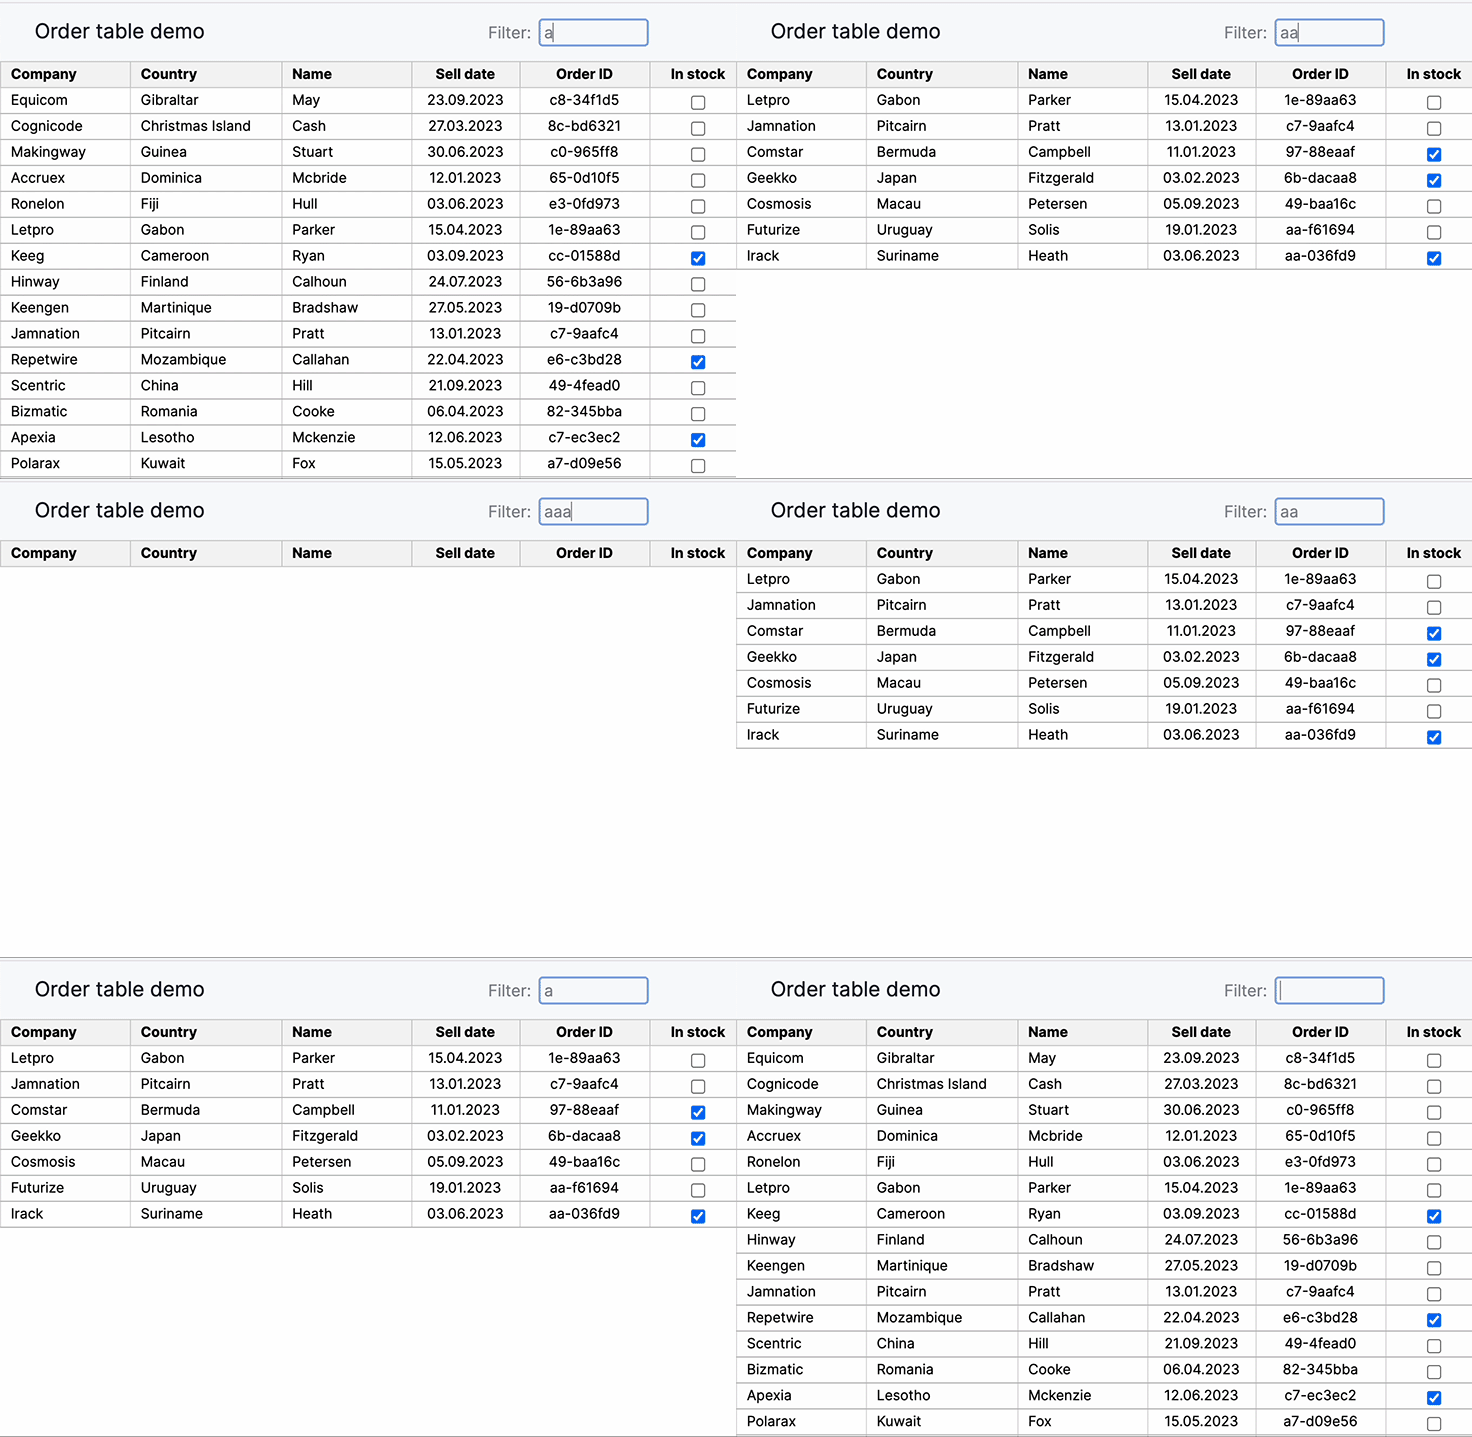
Rows filtering (Search)
This particular design pattern facilitates users in searching for and locating specific values within the large dataset.
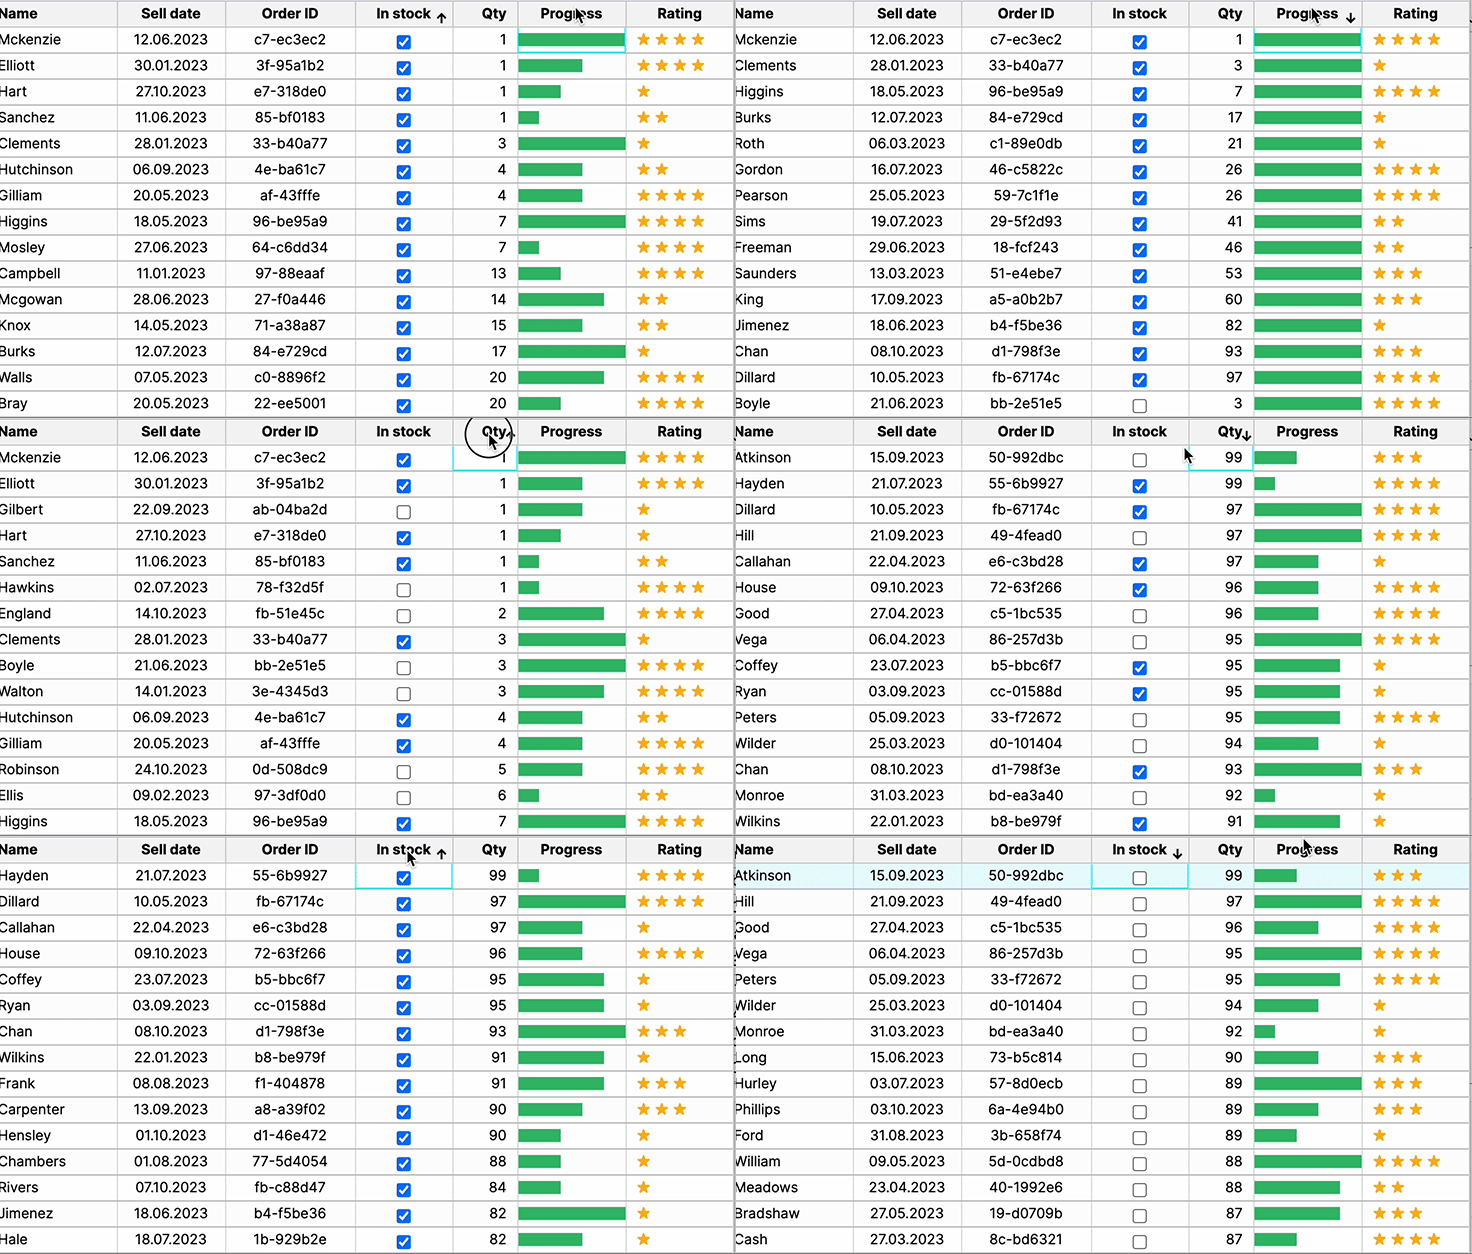
Sortable Columns
Sortable columns enable users to arrange data for quick analysis, aiding in pattern recognition, decision-making, and efficient exploration within the web UI’s data table, enhancing usability and information retrieval.
Hover Actions
Presenting additional action when a user hovers reduces visual clutter.
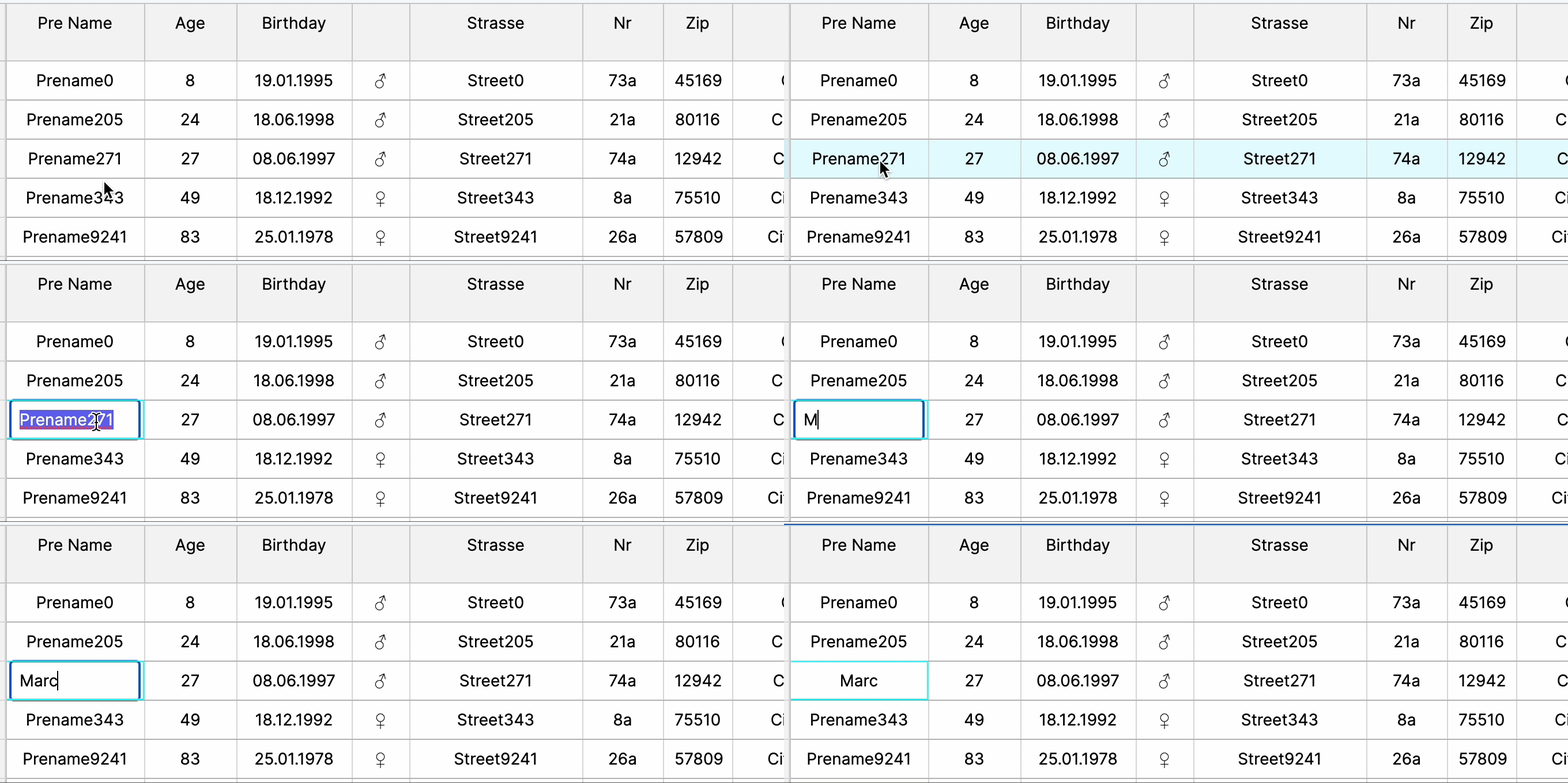
Inline Editing
Inline editing allows immediate data modification within the table, enhancing user interaction and workflow efficiency by enabling quick updates and minimizing navigation, fostering seamless data manipulation within the web UI.
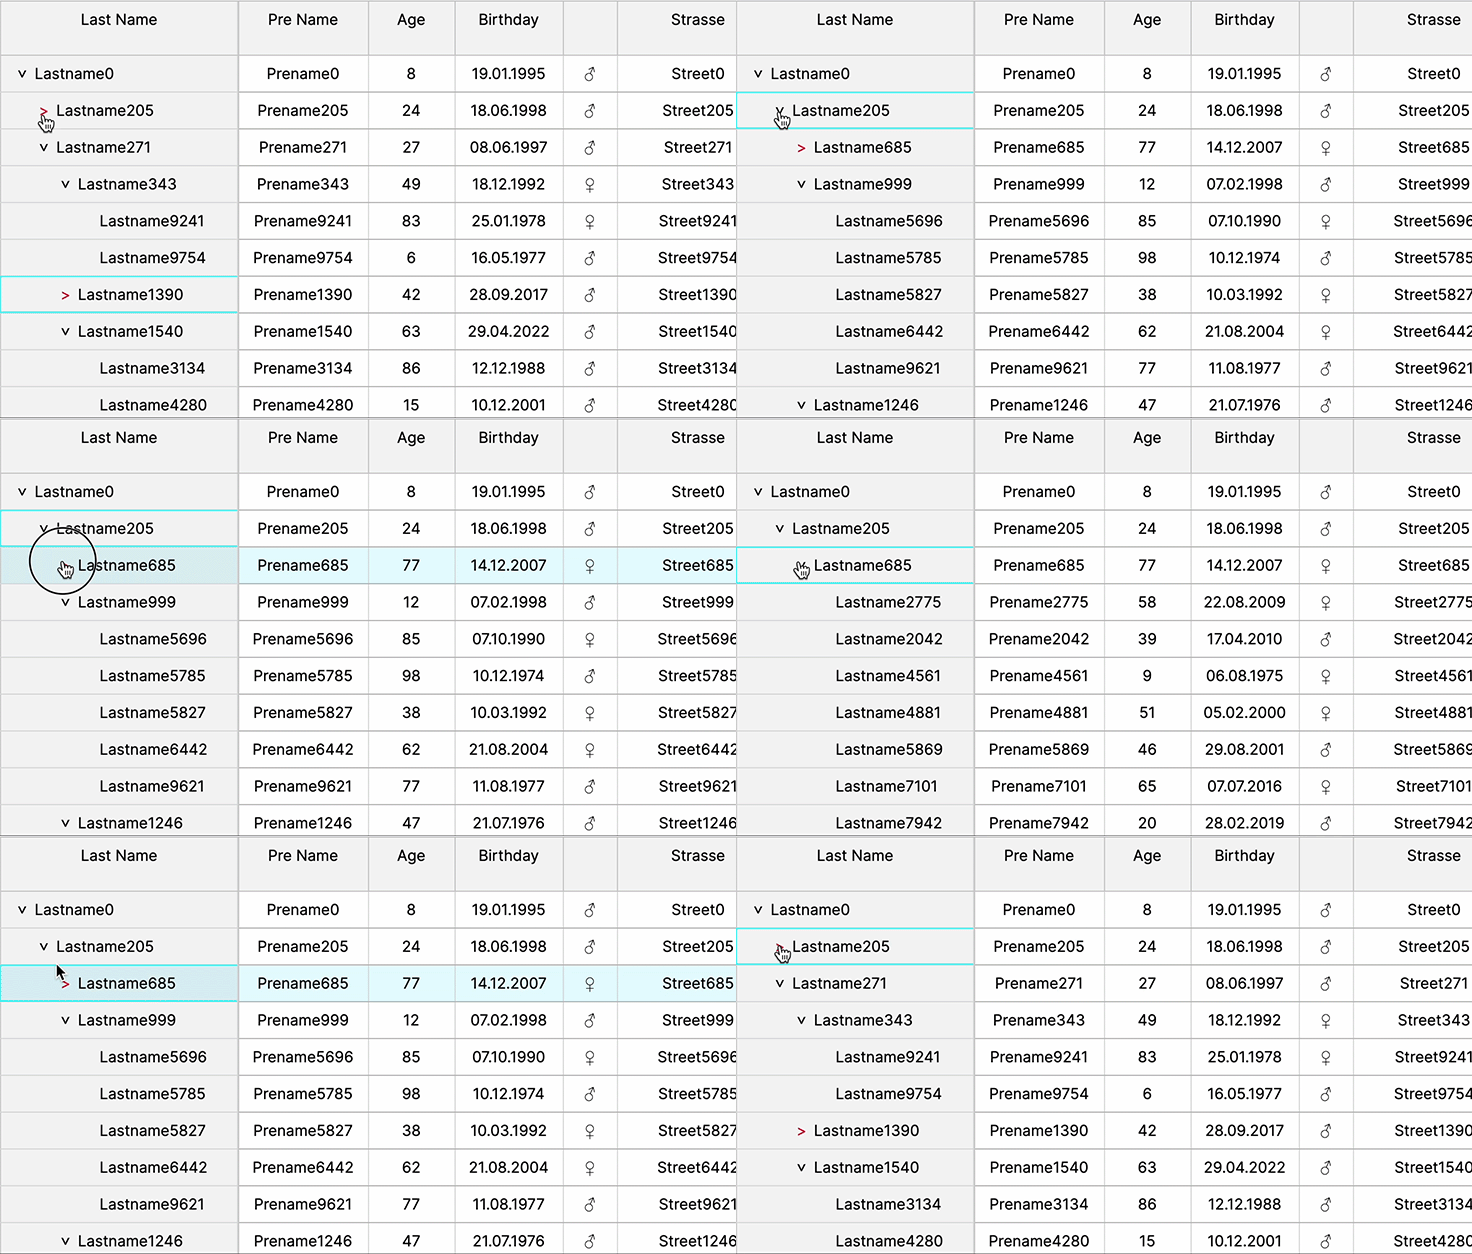
Tree Tables
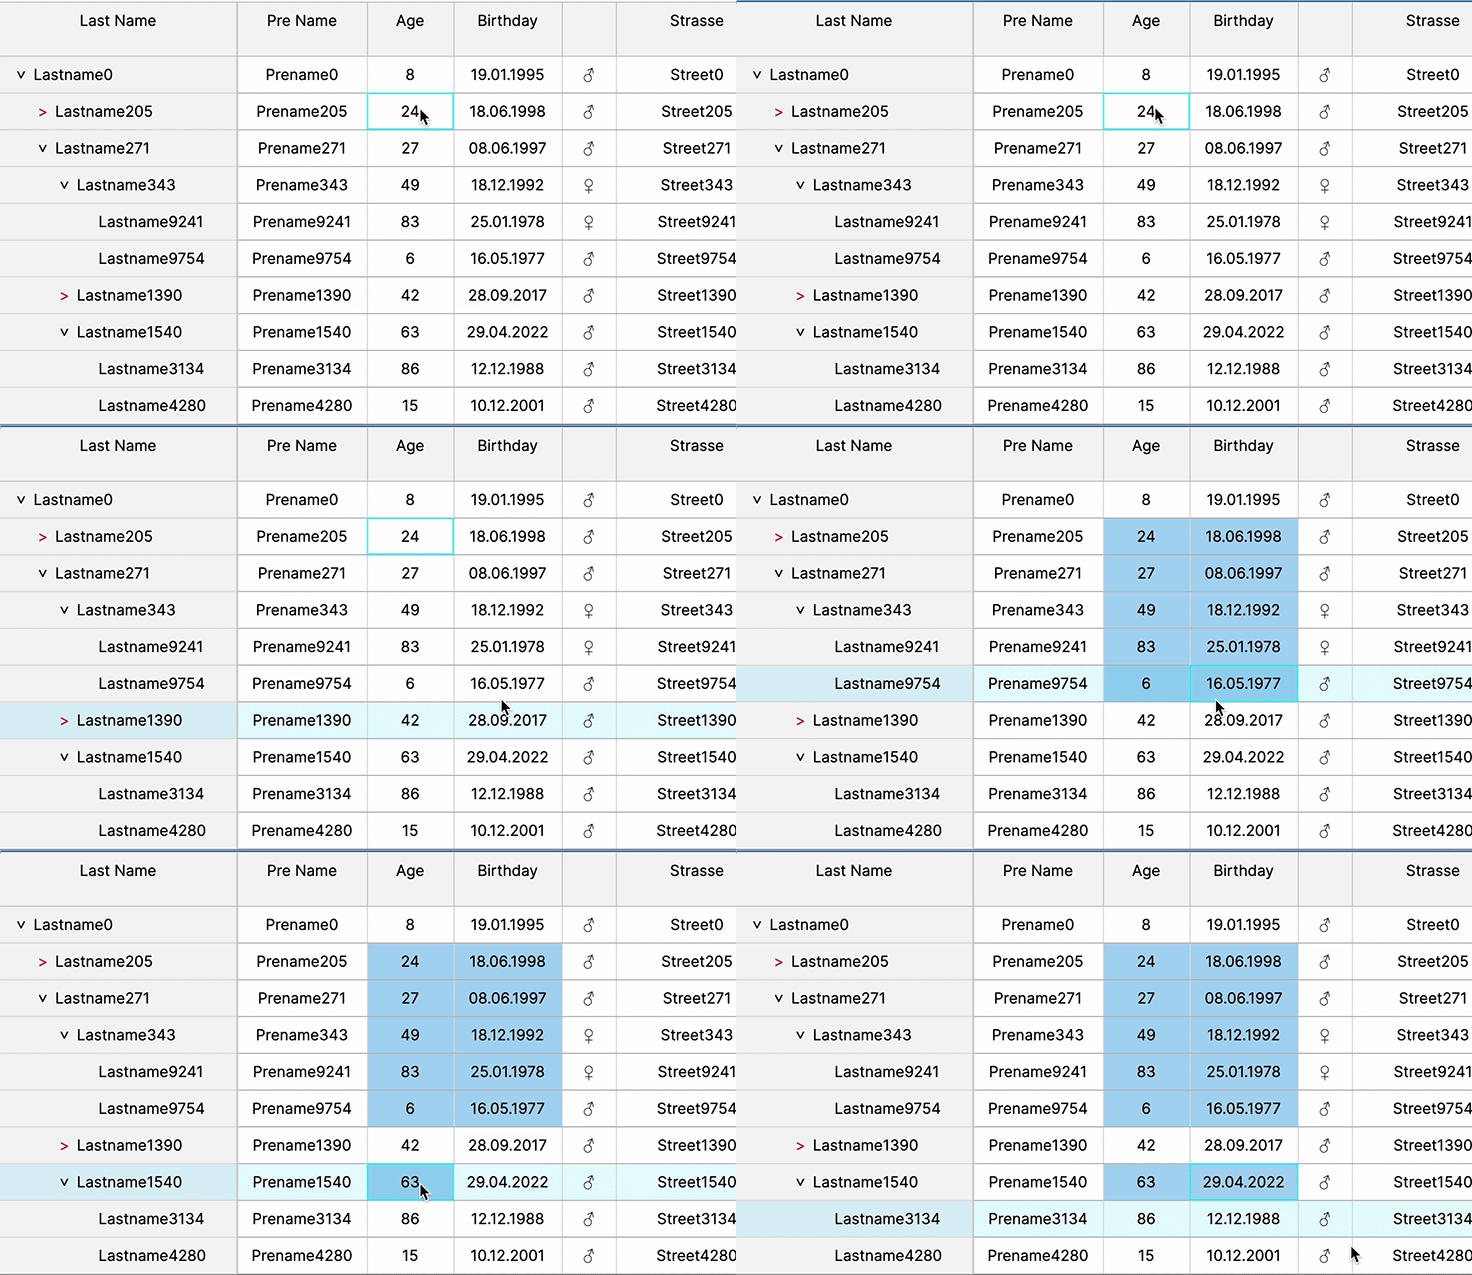
Tree tables offer hierarchical data representation, aiding in visualizing complex relationships and nested structures, fostering easier navigation, comprehension, and organization of data within the web UI’s table interface.
Add / Remove Columns
This pattern permits users to incorporate additional columns from a dataset. It streamlines the table’s data to essential information while offering users the flexibility to add extra columns tailored to their specific needs or use cases.
Cell Selection and Copy Action
In a web UI’s data table, selection features—like row selection, column selection, and multiple range selection—are pivotal for user interaction. They empower users to extract, compare, and manipulate specific data segments efficiently. Copy actions enable swift data transfer, fostering seamless analysis or transfer to other applications. These functionalities streamline workflows, aiding in comprehensive data understanding and facilitating seamless data manipulation. Offering these capabilities enhances user control, expedites decision-making, and promotes a more intuitive, productive experience within the data table interface.
Rapid Cell Updates
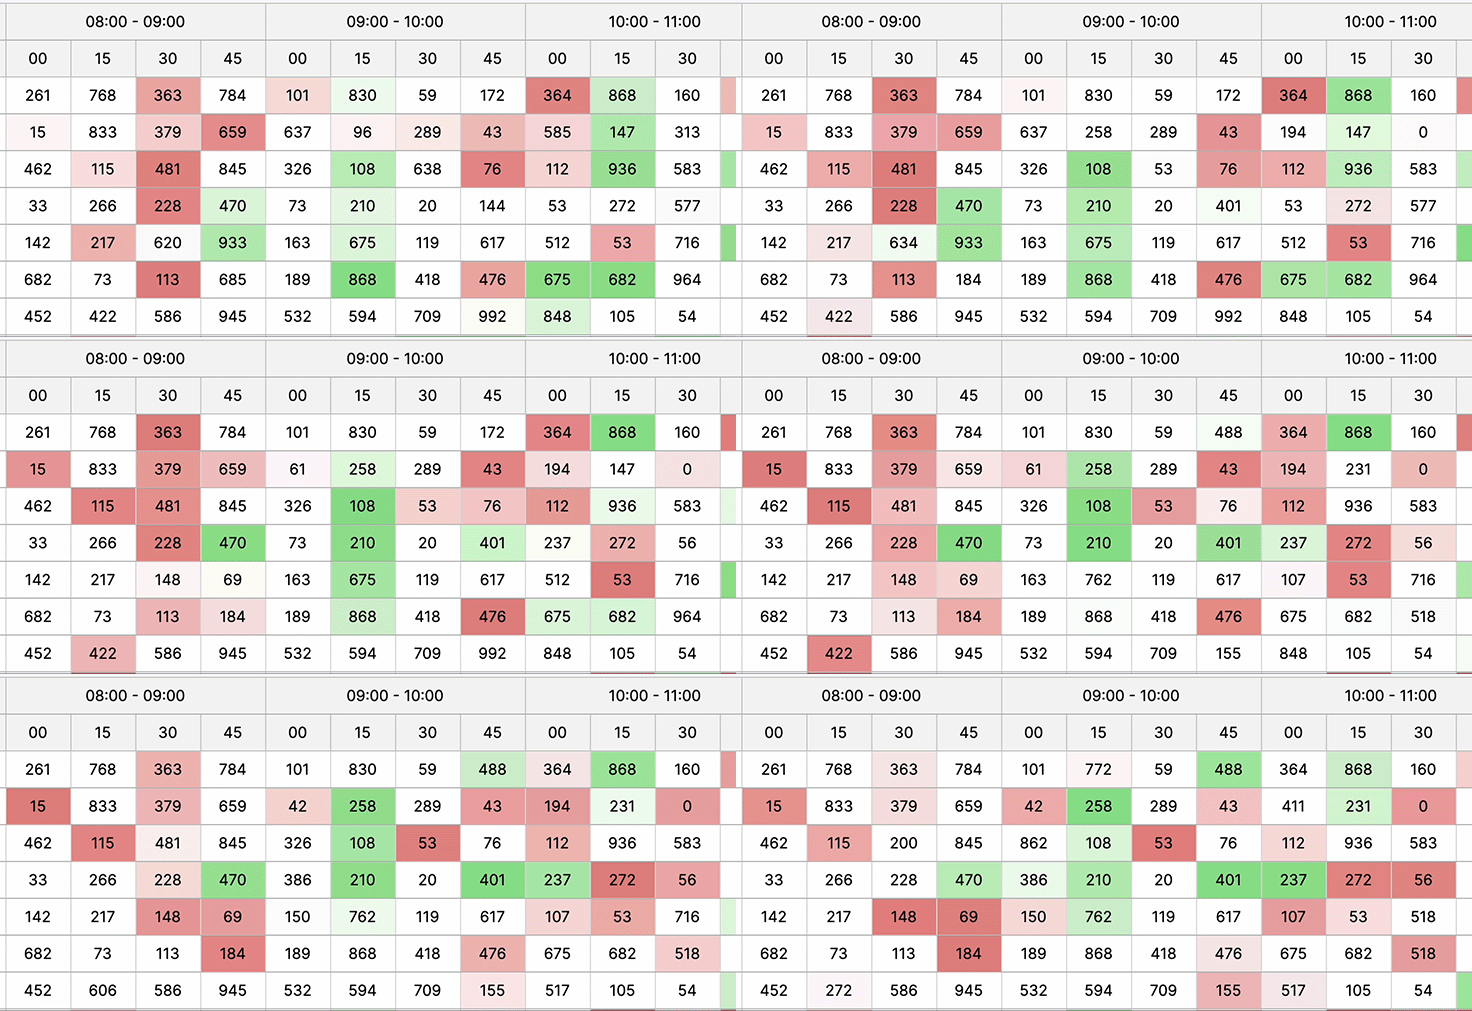
Flashing cells and rapid cell updates are crucial in trading apps for real-time data visualization. They signify critical changes swiftly, aiding traders in immediate decision-making by highlighting dynamic market shifts or crucial information within the data table interface.
Large data sets
Displaying large datasets in a web UI is crucial for comprehensive information access, enabling efficient analysis, informed decision-making, and ensuring users grasp insights swiftly for better problem-solving and understanding complex relationships within the data.
Virtual Scrolling
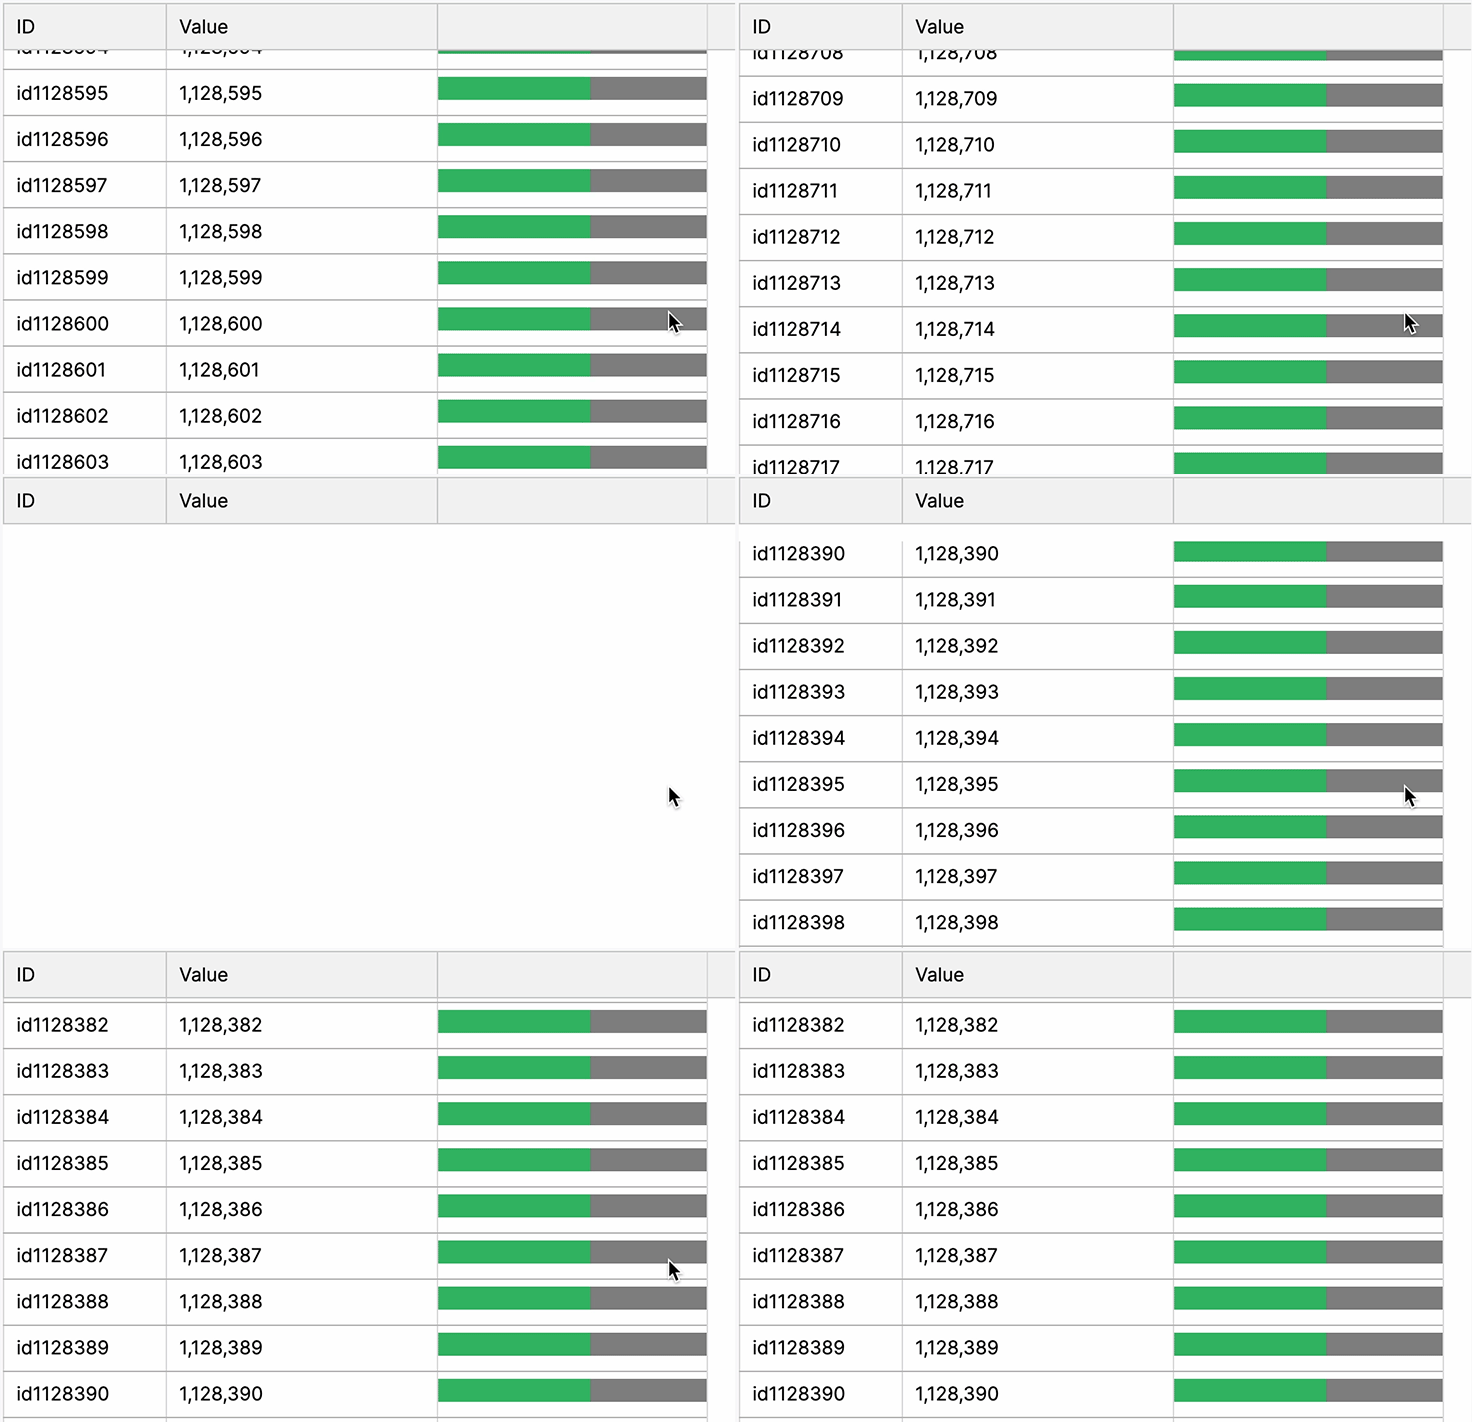
Implementing virtual scrolling in a web UI’s data table is crucial for swift rendering of extensive data. It optimizes performance by selectively rendering visible content, overcoming DOM sluggishness with fast JavaScript operations. This technique accelerates data presentation, mitigating browser slowdowns associated with large datasets.
Virtual Scrolling vs Pageable Table vs Hard Pre-filter
In the realm of managing large datasets within web UIs, the choice between virtual scrolling and a pageable table is crucial for user experience. Virtual scrolling offers a distinct advantage, particularly with extensive datasets, by significantly enhancing user interaction. Unlike traditional paged tables that load all data at once, virtual scrolling dynamically fetches and renders only the visible portion of data, optimizing performance and reducing load times.
This approach ensures smoother navigation, quicker rendering, and minimal strain on system resources, ultimately resulting in a more responsive interface. Users experience seamless scrolling through vast amounts of data without delays, enabling faster access to relevant information. Additionally, virtual scrolling maintains consistent performance regardless of dataset size, making it highly scalable for handling extensive data volumes efficiently.
By prioritizing user experience through enhanced speed, reduced load times, and seamless navigation, virtual scrolling emerges as a superior choice for managing large datasets within web UIs, fostering a more efficient and user-friendly environment.
A pageable table view isn’t inherently an antipattern, as it often provides a practical means to manage large datasets. It presents information in a structured manner by dividing data into manageable pages, allowing users to navigate between these pages. This can enhance usability by offering a more organized presentation of data and avoiding the load of extensive information all at once, which could potentially impact performance.
However, relying solely on a pageable table for handling very large datasets might pose issues. When an application contains a vast number of records and if the paging mechanism isn’t efficiently implemented, it can lead to slow performance. Additionally, user experience may suffer if users frequently need to switch between pages to locate specific data.
Therefore, it’s crucial that the choice of table design considers various factors such as the nature of the data, user needs, and application performance. In some cases, a hybrid approach that combines pageable and virtual scrolling methods might offer a better solution, leveraging the benefits of both approaches to optimize user experience while managing extensive datasets effectively.
A “Hard Pre-filter” refers to the application of predetermined filters to limit and display only specific subsets of data before (loading and) presenting it to the user interface.
Virtual Scrolling:
- Pros: Dynamically loads and displays only the visible portion of data, reducing load times and improving performance. Provides seamless navigation through extensive datasets without overwhelming the user with all data at once. Offers consistent performance regardless of dataset size.
- Cons: Implementation complexity might be higher compared to a simple pageable table. Requires careful handling to maintain smooth scrolling and proper data fetching.
Pageable Table:
- Pros: Organizes data into pages, making it easier for users to navigate through large datasets. Provides a structured view and control over the number of records displayed at a time, potentially improving readability.
- Cons: Loading entire pages might cause slower performance with very large datasets. Users may need to navigate across multiple pages frequently, impacting user experience.
Hard Pre-filter:
- Pros: Filters the dataset before displaying, showing only a subset of relevant information. Can significantly reduce the initial data load, improving performance and responsiveness. If loading data is very costly, a hard pre-filter might be the only solution in some cases.
- Cons: Users might miss out on potentially relevant data that falls outside the preset filters. Changing filters or accessing additional data might require adjusting settings, potentially leading to a less intuitive user experience.
Chunk loading
Chunk loading, dynamically presenting visible content, is vital for managing very large datasets in a web UI’s data table. This method selectively loads data in smaller portions, enhancing performance by circumventing delays associated with rendering extensive datasets at once. By dynamically fetching and displaying only the visible content, it optimizes user experience, ensuring swift navigation and analysis. This approach mitigates potential browser sluggishness, enabling seamless interaction and efficient data exploration within the table interface, allowing users to interact with vast amounts of data without sacrificing responsiveness or usability. Chunk loading can be used with virtual scrolling or pageable tables.
Conclusion
The significance of tables lies in their role as the cornerstone of our data-driven global economy. The quest for data fuels the transformation of traditional industries across energy, media, manufacturing, logistics, healthcare, retail, finance, and government, propelling them into a digital era.
Yet, the true value of data emerges when it can be visualized and acted upon.
Effective UI design focuses on human goals and behaviors, shaping subsequent design choices by influencing behavior in a subtle, often subconscious manner. What people see, where it’s presented, and how they interact all impact their actions. It’s crucial that our design choices contribute to a better world, step by step, starting with the design of each individual data table.